
Understanding the distribution maps
This could get a bit boggy; wellies are recommended. For light relief, I will chuck in a couple of recent snaps.
To bail out, click this:
These points should be understood when interpreting the species maps:
Records held in the NBN Atlas show abundance in ranges of values rather than precise numbers of individuals: 1, 2-5, 6-20, 21-100 etc. Also, although less so in recent years "Presence" is sometimes recorded without any indication of numbers (11% in 2015-2024 and 42% in 1980-1999 within the New Forest region). To deal with these, I applied an adjustment in each case. The adjustment was calculated for each species as the average among the other records having an abundance range; it doesn't affect the average value but it does ensure that both types of map have a matching set of dots (as opposed to simply ignoring "presence" records) and that the average value better reflects reality (rather than simply assuming a count of 1). Even so, the abundance ranges used in the NBN Atlas mean that the averages here are lower than they should be, since I always assume the lower bound of each range.
Two main factors influence the RPM maps: observer effort and a species' persistence at a location. It isn't easy to know which of these factors has caused a high value in any monad. Odo enthusiasts are sometimes prone to twitching and I was once among half a dozen people gathered around a tiny pond in Titchfield Haven (not in the New Forest) to get snaps of a solitary male Southern Migrant Hawker; eight records resulted from that single individual over a two week period so it's fair to say that observer effort was responsible on that occasion, rather than species' persistence over several years. Persistence itself can cause increased observer effort which results in the RPM being skewed in favour of some areas. There are many records of Southern Damselfly in the Crockford Bottom area, some of them due to research into this endangered species. The APR confirms that Crockford is indeed a hotspot but that in itself attracts more attention from enthusiasts and consequently more records.
Of course, for species such as Large Red Damselfly, there aren't any hotspots - put out a bucket of water with a leaf on the surface in late May/early June and at least one will turn up before long. In such cases the maps tell us little more than "widespread within the region" and the field guides and BDS website are the best places for learning what habitat each species prefers. Others are more limited in range - Brown Hawker for example seem to prefer western parts. The extreme case is White-legged Damselfly, which is unlikely to be found very far from Ober Water and Black Water.
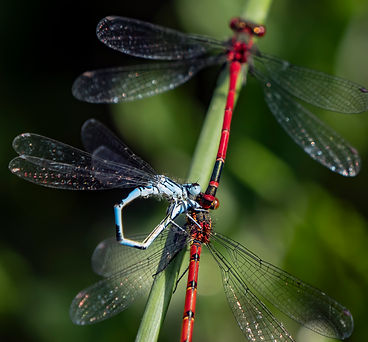
I promised snaps, so here is one -------------------------------------------->
A nice early Southern Damselfly record, 1 May 2025. This male seems just a little confused as to its identity. I once saw a male Small Red Damselfly try a similar stunt with a tandem pair of White-legged; they all took off together, twelve wings, quite a sight!
Selection of site size affects record count within a monad. When I first started recording, iRecord seemed to encourage me to choose small sites with precise grid references. I settled on 100m precision but even this soon became tedious especially when walking a long stream, keeping count of each species for each section. I then learned that the BDS are interested in monad precision, nothing more - so I changed my method and now in situations where a stream traverses a whole monad, I have just one site unless there is a distinct change of habitat. There are some cases in the Atlas where records are at ten metre precision, resulting in many records for a species on a given day but with a low average individual count. These might be due to scientific study I suppose. By working with APR and RPM together, the overall picture balances to some extent.
Public access to various parts of the Forest has changed over the years. It has been a national park since 2005 but I don't know when the current extent of public access land was established - possibly as a result of the Countryside and Rights of Way Act 2000? Outside the "access land", there are varying degrees of public access dependent mostly on rights of way. Some parts have little or none. There are some excellent records from Beaulieu Estate up to 1992, plus a handful more up to 2011 but none since. There are likely still to be eighteen or so species in that location, we just need someone to ask nicely and take a look. As already suggested, detailed comparisons shouldn't be made at monad level.
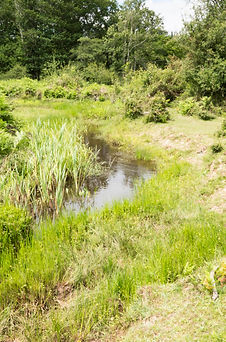
Not recent, not even an odo ... this is Black Water, mentioned below, -------------------->
near the western edge of the clearing.
Being subject to protection by various organisations and legislative bodies, the overall habitat hasn't changed as much as in other parts of the country but there have been some localised changes. Improvement projects and the reduction in tree plantation coverage have given new opportunities for expansion. I think the spread of White-legged Damselfly from Ober Water to Black Water might have happened after scrub and tree clearance at sometime in the past. About five hectares seem to have been cleared, exposing 500m of stream (not counting meanders) to increased sunlight and presumably a new set of vegetation. Black Water now rivals Ober Water for White-legged Damselfly population density.
The BDS "State of Dragonflies 2021" report (SoD2021) looks at trends in the distribution of all resident and regular migrant species in Britain and Ireland since 1970. It is available for download from the BDS web site. The analyses are based on occupancy of monads but assessed at country level (Ireland, Northern Ireland, Scotland, Wales and England) and additionally assessed over the five countries combined. "Occupancy" in this context is the proportion of monads having at least one record of a species. SoD2021 uses a statistical model to estimate results that include monads for which there are no actual records, giving a 90% or in many cases 95% confidence in the credibility of their results for each species. No such model has been used to produce these maps ... no record, no dot. Along with the comments on some species distribution maps, I have included such as "SoD2021 England nn% increase/decrease", meaning that the results published in SoD2021 tell us that for a given species, occupancy across England has increased/decreased by nn%. Changes are expressed as a change in the proportion of occupied monads across the whole relevant region, not proportional to the previous number of monads. So if Aeshna ambulans occupied 5% of England's monads in 1970 and 15% in 2021, SoD2021 would report an increase of 10%, not 300%.
In a short section on species richness as opposed to occupancy, SoD2021 has this to say "... too detailed an interpretation of species richness maps is hampered by the effects of increased recording effort ... This needs to be considered when interpreting changes in the maps", which sounds familiar.