
Species distribution maps
The area covered includes all of the national park, extended to the coast in the east and south and towards the River Avon (but not including it) in the west. This amounts to most of the New Forest District Council area but not those parts which lie west of the Avon. A few towns and villages are shown in this inital map, to help orient the viewer; for clarity, the names are omitted in the species maps. For anyone not used to Ordnance Survey grid references, the red dot is at SU2605, ie two letters for the 100km grid square from the left, followed by two eastings digits from the top then two northings digits from the left side. This value can be used to locate the monad (1km grid square) on your own map, phone or wherever.
Click on the map to enlarge it
Click on the map to enlarge it.

The individual species maps show adult distribution for all the species having a regular presence in the New Forest in the ten years to 2024; occasional visitors are excluded: Southern Migrant Hawker, Lesser Emperor, Vagrant Emperor and Red-veined Darter. There are too few records for these to allow a meaningful presentation of their distribution. Likewise Willow Emerald Damselfly, which although likely to become more than an occasional visitor, currently has just eight records across seven monads. Also excluded are two species which were recorded only during last century: Yellow-winged Darter and Variable Damselfly.
There are possibly insufficient data to allow firm comparisons to be drawn between periods or from monad to monad, especially where the number of records for a species is low. Add to this the unstructured nature of citizen science observation and it is clear that the maps shouldn't be relied on heavily for small-scale details. However, I am confident that they are valid for overall trends across the region.
Scroll for more ↓
The first of these two general maps is a pair showing observer effort across the region, ie the total number of records for all species in each monad. Each part of the pair covers a different period, the same periods as are shown in some maps for individual species. The two figures of total records for all species show an increase of 20% since the earlier period. While subject to all manner of caveats, this rough estimate of relative observer effort gives us an expected uplift in record counts between periods for any species having a stable presence across the region. The second shows the number of different species seen in each monad. These two general maps can help when used in conjunction with the average count and records per monad. For anyone wanting to examine a species in detail, it might be worthwhile taking a screenshot of the total records maps and viewing it in a separate window; it would save some leaping about the site. Right-click "Save image as" produces a .avif file, which is next to useless.


Individual species
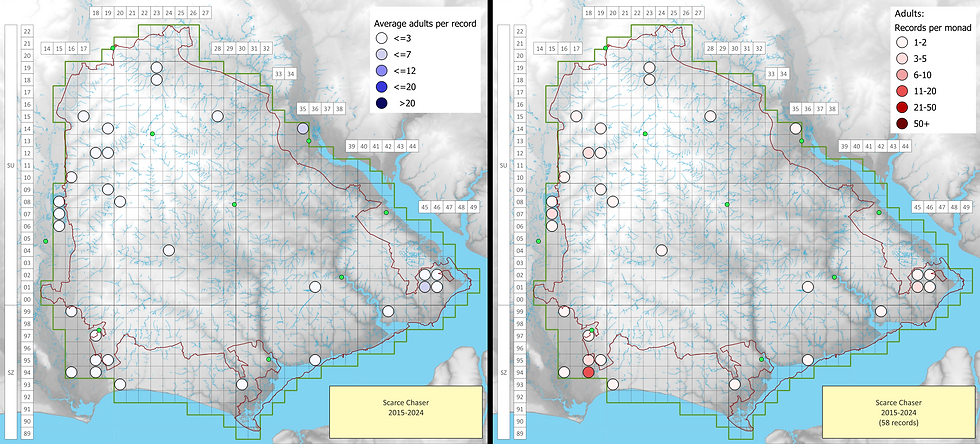
There are two types of map for each species. One shows the average count of adults per record (APR) and takes no account of observer effort in terms of the number of records and gives no indication of a species' persistence at a location. The other shows the number of records per monad (RPM) for the same species. Cross checking between the two map types can help form a fuller picture. For example, the APR for Small Red Damselfly in the monad spanning Cunninger Bottom and Stone Quarry Bottom (SU1916) is higher than twenty. Cross checking with the RPM shows that there are no more than two records there for the species. In fact I know from the NBN Atlas that there is only one record there for Small Red Damselfly, in Cunninger Bottom, July 2023. Perhaps it's a newly established population ... I should take another look sometime. Attempts to combine APR and RPM in a single value all result in either lost information or peculiar effects in other ways and displaying both values in a single dot just boggles my eyes.
In both map types, the coloured dots show where records exist - the darker the dot, the higher the average count (first map type, APR) or the more records in the monad (second map type, RPM). Where distribution or population density of any species has changed significantly since the last two decades of last century, corresponding maps are included, with my thoughts on some. The total record count for each species is shown on the RPM map for each period. For a detailed explanation of the maps and of the references to State of Dragonflies 2021, plus further thoughts, click this:
Otherwise, here are the maps (click on each image to enlarge it; once opened, scroll sideways between periods):
Zygoptera (Damselflies)
Beautiful Demoiselle 2015-2024

Banded Demoiselle 2015-2024
1980-1999


I can find no reference to Banded Demoiselle preferring chalk streams to the mostly acidic waters of the New Forest, yet while they are plentiful along the nearby Avon, Test, Itchen and Meon, they are not at all common here. There are too few records to draw conclusions as to any change in distribution but both periods are shown just to point out that what appears to have been a small population along Avon Water has since gone (Avon Water where it flows past Sway, not the River Avon).
Emerald Damselfly 2015-2024
1980-1999
SoD2021 England: 16.8% decrease 1970-2021.


Large Red Damselfly 2015-2024

Small Red Damselfly 2015-2024

White-legged Damselfly 2015-2024
1980-1999
SoD2021 England: 4% increase 1970-2021.


As mentioned elsewhere in this web site, I think scrub and woodland clearance between Black Water and Dames Slough Inclosure might be partly responsible for the subsequent spread from Ober Water. Additionally, the species has been found progressively further upstream along Mill Lawn Brook in recent years (Mill Lawn Brook is Ober Water, having a different name west of the A35).
Southern Damselfly 2015-2024

Azure Damselfly 2015-2024

Common Blue Damselfly 2015-2024
1980-1999
SoD2021 England: 3.4% increase 1970-2021.


This one really surprised me. Using the "rough estimate of relative observer effort" mentioned above, one might expect nearly twice as many records as have in fact been submitted for the later period. Apart from declining numbers, the maps show decreased occupancy in a large area centred on Lyndhurst and again in the south west. The general map for all species shows these areas to have been fairly well covered by observers. Any ideas, anyone? This probably won't get past the editor but anyway, let's try: If this decline is real and it continues, the Green-eyed Hawker and Moorland Hawker lobby will be wanting to rename the Common Blue as "Not so Common Blue Damselfly".
Blue-tailed Damselfly 2015-2024

It takes me a few days early each season to tune my eyes to be able to tell these apart from their usually smaller relative the Scarce Blue-tailed Damselfly. Just like we aren't supposed to have a favourite child, I sometimes struggle not to feel disappointed when one turns out to be Ischnura elegans and not Ischnura pumilio.
Scarce Blue-tailed Damselfly 2015-2024
1980-1999
SoD2021 England: 2.2% decrease 1970-2021.


A pet subject of mine, hence the high number of records three kilometres west of Hythe, a site I visit several times a year hoping to find definitive proof of successful breeding. The most I have seen in any visit there was in May 2025 with nine adults including two ovipositing females but I have seen some there every year since 2018. A nod to Simon Stone who likewise searches for these in all sorts of remote places ("remote" being relative of course, it is Hampshire). They have a preference for shallow water with only short vegetation, such as the seepages and flushes often found in New Forest valleys with the vegetation kept short by the livestock and even minimised in extent by trampling. This kind of habitat tends to be fairly stable within the Forest and allows permanent rather than transient populations which elsewhere pop up in newly-created sites but disperse once the vegetation becomes too much. I wonder then if dessication of shallow sites in recent years might be responsible for the apparent decline exceeding that in England at large. Another feature of this species is that it very likely now produces two generations each year in Britain (David Chelmick, Journal of the BDS volume 38 number 1, April 2022) and my interest in them is at least partly driven by wanting to find more evidence to support this. This issue is considered further in the flight period pages of this web site.
Fact for the day: another Ischnura, Ischnura hastata, has a population in the Azores which is able to reproduce without involvement of a male (Parthenogenetic Ischnura hastata, widespread in the Azores, 2005: Adolfo Cordero-Rivera, M. Olalla Lorenzo-Carballa, Virgilio Vieira). I can't find a reference for this next bit but I'm sure I remember it correctly - the offspring are not clones of the female parent ... ?!?
Red-eyed Damselfly 2015-2024

Small Red-eyed Damselfly 2015-2024

Anisoptera (Dragonlflies)
Hairy Dragonfly 2015-2024
1980-1999
SoD2021 England: 22.9% increase 1970-2021.


I have seen these in only five monads plus a sixth in May 2025. I don't see them often but in two of those monads - the darker ones on the 2015-2024 RPM map - they turn up reliably year after year.
Common Hawker 2015-2024
1980-1999
SoD2021 England: 15.4% decrease 1970-2021.


This species is discussed in Alan Holmes' article mentioned with the Black Darter maps below. My comments there apply here too.
Migrant Hawker 2015-2024
1980-1999
SoD2021 England: 34.3% increase 1970-2021.


For several species, increased occupancy reported in SoD2021 reflects range expansion into northern England, rather than necessarily increased density locally. Migrant Hawker does seem to have done very well here though.
Southern Hawker 2015-2024

Brown Hawker 2015-2024

Emperor 2015-2024

Golden-ringed Dragonfly 2015-2024

Downy Emerald 2015-2024

Four-spotted Chaser 2015-2024

Broad-bodied Chaser 2015-2024

Scarce Chaser 2015-2024
1980-1999
SoD2021 England: 8.4% increase 1970-2021.

Black-tailed Skimmer 2015-2024
1980-1999
SoD2021 England: 29.4% increase 1970-2021.


Keeled Skimmer 2015-2024

Black Darter 2015-2024
1980-1999
SoD2021 England: 10.6% decrease 1970-2021.

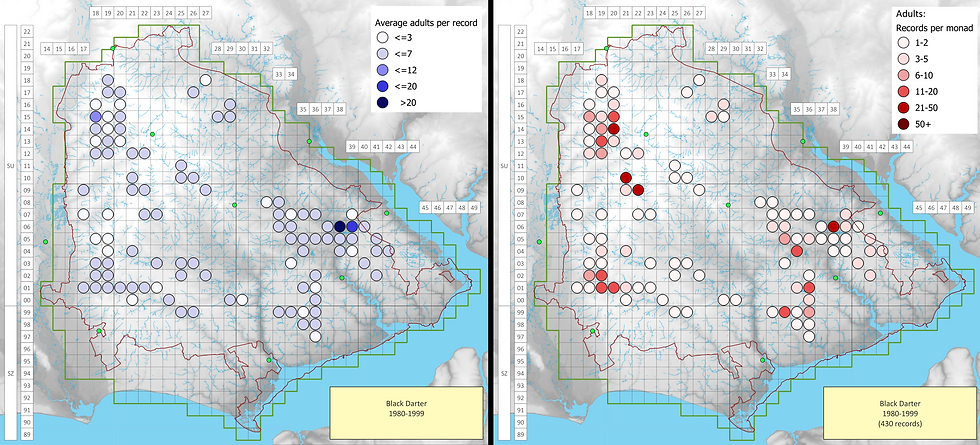
Most of the decrease in England has been in southern counties as discussed by Alan Holmes in his article "Our Missing Heathland Dragonflies" in issue 86 of the BDS "Dragonfly News", Autumn 2024. Alan tells us that there seems to be a refuge in the colder uplands of southern Dartmoor but here in the Forest the dramatic decline is plain to see.
Common Darter 2015-2024

Ruddy Darter 2015-2024
