
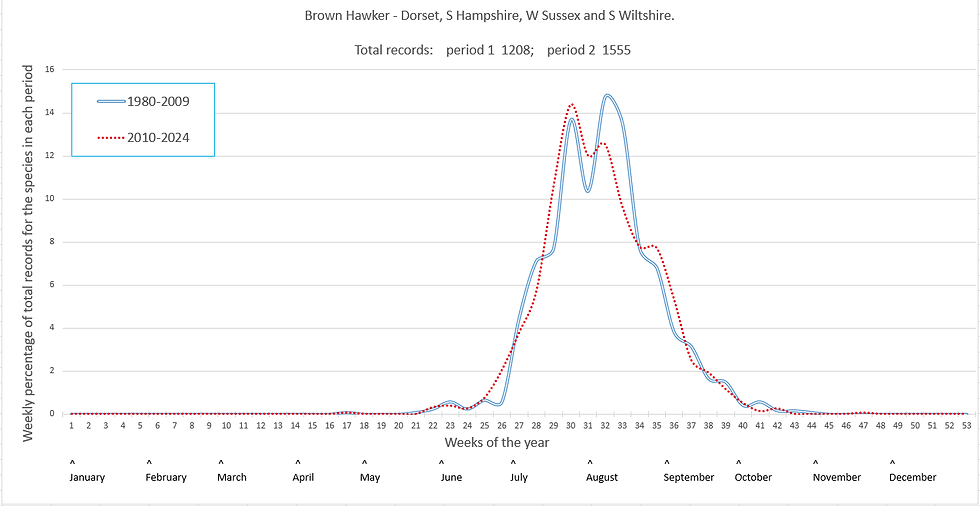
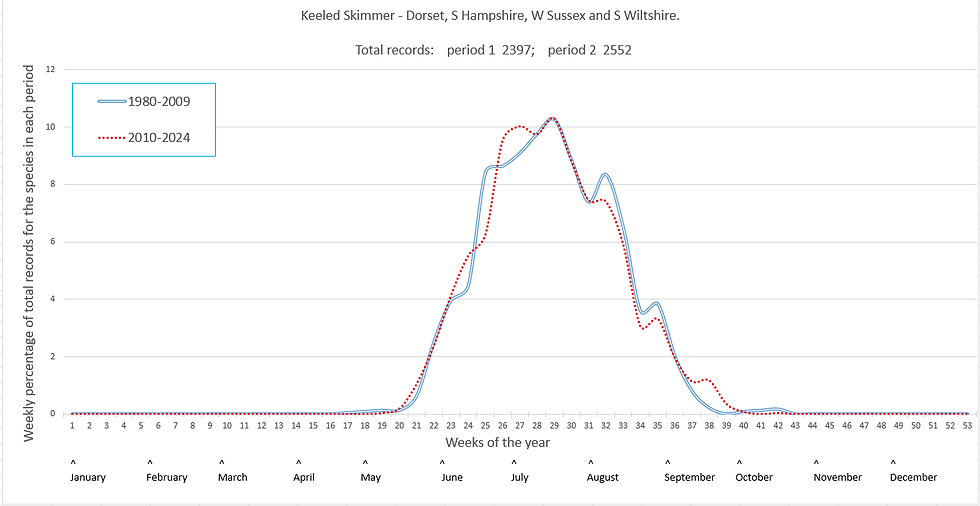
Flight period graphs
At the simplest, these graphs show when we are most likely to see each species, using data for the years 2010-2024. Most have an additional line for 1980-2009, showing how flight periods have changed in several cases. For any species that aren't shown, refer to the field guides mentioned in "About this site" or use the link to the BDS website. Most of those missing are species rarely found in the New Forest, with insufficient local data to make a meaningful distribution line.
The month boundaries relative to the week numbers are approximate, since they change from year to year and I might have short changed April in the edit; they are offered only as a guide and are based on week numbers in 2025. Various calendars are available online; I have been using this one: https://weeknumber.co.uk/weeks
Aiming to improve the appearance - to get enough data to have smoother lines - I used records from all of South Hampshire and the two adjacent coastal vice counties plus South Wiltshire, in which sits a small part of the national park. South Wiltshire might not generally share the same climate as Dorset, South Hampshire and West Sussex but there are far fewer records from there over the 1980-2024 period (5.6k out of 130k total across all four vice counties) so the effect on the overall picture would be minimal and I wanted to include all of the Forest data.
The graphs should really be called "Flight period near water graphs". For an explanation of why that should be and for more on what the graphs represent, click here:
Otherwise, continue below:
↓ Scroll for more, hover over an image to see the species, click on it to enlarge it. Species ordering follows that found in most popular field guides.
Zygoptera
Demoiselles and Emerald damselflies


Red damselflies


Blue damselflies


Anisoptera
Large dragonflies


Chasers


Skimmers

Darters


